Diagnostic Tools for web
Heads Up!
This article is several years old now, and much has happened since then, so please keep that in mind while reading it.
But only a few hours into the first auction, we received the first complaints from the client’s customers. They said their phones froze for a bit when they entered the website – some users even said it crashed their browser app. Do you want to see what that looks like
!Warning! Open the link at your own risk - it may freeze your browser!
https://codepen.io/rammi1995/pen/vYJWoBa
If you didn´t open the link, I’ll tell you what happens. First, you will see an empty screen, but after a while, data pops in.
class App {
    constructor() {
      this.items = [];

      // TEST Data, replacement of the real signalR
      for(var i = 0; i < 1000; i++) {
        this.items.push({
          'lot': i,
          'priceDKK': '200',
          'priceUSD': '20',
          'name': 'test - ' + i
         });

        if (i == 999)
            this.render();
      }
    }

    render() {
        const txt = JSON.parse(document.getElementById('table-body').dataset.txt);
        document.getElementById('table-body').innerHTML = '';

        this.items.forEach((elm) => {
            document.getElementById('table-body').innerHTML = document.getElementById('table-body').innerHTML + `<div class="table-row">
                <div class="table-cell"><span class="label">${txt.lot}</span> ${elm.lot}</div >
                <div class="table-cell"><span class="label">${txt.DKK} / ${txt.USD}</span> ${elm.priceDKK} / ${elm.priceUSD}</div >
                <div class="table-cell"><span class="label">${txt.Name}</span> ${elm.name}</div >
            </div>`;
        });
    }
}

document.addEventListener('DOMContentLoaded', () => new App());
I had never experienced this issue before, and the accept test didn’t find anything. So what could the problem be?
Mind blown by the performance tab
I did what we all do when we experience a new issue: Googled. But there were barely any results. Finally, I read someone was suggesting the performance tab in Dev-tools might help. I went to the application, fired up the performance tab, hit the record button, reloaded the website, and I was mind blown!
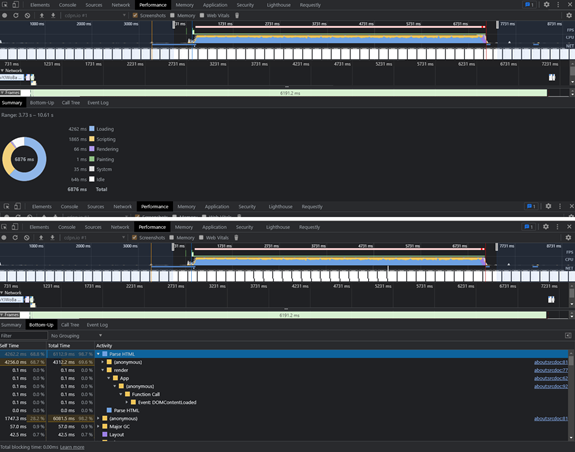
As you can see in the summary, the web application spent ~4.3s on loading and ~1.9s on scripting. If you click Bottom-Up, you will see it spent ~99% of its time in a function named Parse HTML. If you expand that function, you can see another function named Render, which is our function. So we can conclude that our function Render is triggering the Parse HTML.
If you’re unfamiliar with Parse HTML, it is triggered every time you try to parse in a string to the DOM tree. So, in my example, it is triggered on line 19 and repeated on line 22.
How do we fix the issue?
Now we have isolated the issue – the web application is spending too much time on the Parse HTML. What would you do to fix it? Try to see if you can make the application perform better with these two simple rules: Only change the Render function behavior and there no external frameworks are allowed.
(For background: External frameworks such as VueJs or AngularJs are not allowed because the application was built to respond in milliseconds and with only a few KB to download. The application was used by people all around the world and in some countries, a MB is still a bit expensive. Furthermore, the server was based in Denmark and had to deliver content to China – fast. I know, the setup could have been better, but it was what we had at the time. VueJs is 33KB and a bit overkill when you only need 5% of the framework, and the application was depending on SignalR as an external framework to provide a real-time data feed.)
My first thought was to avoid writing to the DOM repeatedly in line 22. So I made this minor change:
See the Pen by rammi1995 (@rammi1995) on CodePen.
In line 18, I created a variable of an empty string and populated it with data in line 23, and finally dumped it to DOM at line 30.
You might be wondering what the difference is? With this solution, we are only working in memory and only triggering the Parse HTML two times instead of 1000 times. When visiting the website, you can see the data is almost instantly popping in.
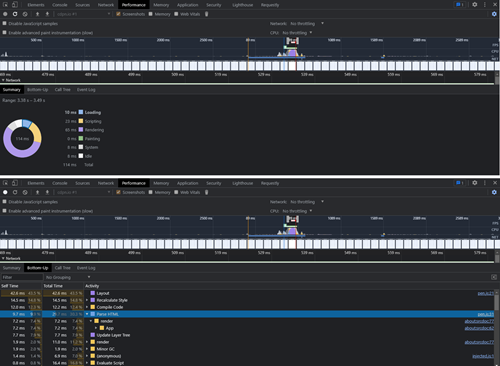
If we run a new performance test in Dev-tools, the web application use 10ms on loading and 23ms on scripting. We are only using ~33% in bottom up, which is an outstanding improvement.
My key takeaway from this experience was that I need to write as little to the DOM as possible in the future.
Diagnostic tools in Visual Studio
Next tip on the list is found in Visual Studio. I am using VS 2019 – you might wonder why it isn’t VS 2022. I haven’t had the time to explore 2022 fully yet, but hey, we are still in the year 2021, right? ;)
I want to shed a little light on the diagnostic tools. You may have seen or noticed the window without really knowing what to use it for?
Every time you hit F5 and want to debug your solution, a window pops up and shows a CPU-performance indicator. This is the diagnostic tools window. If you have turned it off, you can always turn it on again by hitting CTRL + ALT + F2 or under the menu Debug - Windows - Show diagnostic tools. Personally, I prefer to keep the window open when I debug my solutions, so I can easily tell if something makes the CPU go bananas where I expected it to be silent.
As an example, I have created a basic Umbraco v8.17.1 website with the starter kit. In addition, I created two doctypes; news-container and news. The news-container and news could be descendants of a news-container. Then I created 10,000 articles. I always want nine of the newest articles to show regardless of where the articles are located in the containers, so I end up with this piece of code.
using System;
using System.Collections.Generic;
using System.Linq;
using System.Web;
using Umbraco.Core.Models.PublishedContent;
using Umbraco.Web;
using Umbraco_1.Models;

namespace Umbraco_1.Service
{
    public class NewsService
    {
        public List<ArticleEntry> GetSectionArticles(IPublishedContent content)
        {
            List<ArticleEntry> _articles = new List<ArticleEntry>();

            foreach (var child in content.Children)
            {
                if (child.ContentType.Alias == "news")
                {
                    foreach (var level2 in child.Children)
                    {
                        if (level2.ContentType.Alias == "news")
                        {
                            foreach (var level3 in level2.Children)
                            {
                                if (level3.ContentType.Alias == "news")
                                {
                                    foreach (var level4 in level3.Children)
                                    {
                                        if (level4.ContentType.Alias == "newsItem")
                                        {
                                            _articles.Add(new ArticleEntry()
                                            {
                                                Date = level4.Value<DateTime>("publishedDate"),
                                                Headline = level4.Value<string>("headline"),
                                                Manchet = level4.Value<string>("manchet"),
                                                Tags = level4.Value<string[]>("tags"),
                                                Url = level4.Url(mode: UrlMode.Absolute),
                                                Image = level4.Value<IPublishedContent>("image")?.GetCropUrl("news grid"),
                                            });
                                        }
                                    }
                                }
                                else
                                {
                                    _articles.Add(new ArticleEntry()
                                    {
                                        Date = level3.Value<DateTime>("publishedDate"),
                                        Headline = level3.Value<string>("headline"),
                                        Manchet = level3.Value<string>("manchet"),
                                        Tags = level3.Value<string[]>("tags"),
                                        Url = level3.Url(mode: UrlMode.Absolute),
                                        Image = level3.Value<IPublishedContent>("image")?.GetCropUrl("news grid"),
                                    });
                                }
                            }
                        }
                        else
                        {
                            _articles.Add(new ArticleEntry()
                            {
                                Date = level2.Value<DateTime>("publishedDate"),
                                Headline = level2.Value<string>("headline"),
                                Manchet = level2.Value<string>("manchet"),
                                Tags = level2.Value<string[]>("tags"),
                                Url = level2.Url(mode: UrlMode.Absolute),
                                Image = level2.Value<IPublishedContent>("image")?.GetCropUrl("news grid"),
                            });
                        }
                    }
                }
                else
                {
                    _articles.Add(new ArticleEntry()
                    {
                        Date = child.Value<DateTime>("publishedDate"),
                        Headline = child.Value<string>("headline"),
                        Manchet = child.Value<string>("manchet"),
                        Tags = child.Value<string[]>("tags"),
                        Url = child.Url(mode: UrlMode.Absolute),
                        Image = child.Value<IPublishedContent>("image")?.GetCropUrl("news grid"),
                    });
                }
            }

            return _articles.OrderBy(x => x.Date).Take(9).ToList();
        }
    }
}
Beautiful, isn’t it? However, after loading just the front page, I get a response of 200ms – the site normally responds after 10ms on average, so something is definitely wrong.
In the diagnostic tools, I can see a CPU spike on 15-18% when reloading the site. If I upscale my test from one user to 500 users connecting at the same time, the CPU goes to 100% usage for a moment and the load time is 11.3S on average. Worst case scenario here would be that the code causes a CPU overload, which can lead to server crash or a server shutdown.
Why does this bug occur – even years after launch? Most of us probably don’t test to see if our code can withstand 10.000 articles and a lot of pressure. We do more like 200 articles, hit F5 multiple times and the job is done. But that might not be the best way. Let’s dive into it and see how we can perfect the code, so it doesn’t tear down our CPU and loading time.
Let’s fix it
using System;
using System.Collections.Generic;
using System.Linq;
using System.Web;
using Umbraco.Core.Models.PublishedContent;
using Umbraco.Web;
using Umbraco_1.Models;

namespace Umbraco_1.Service
{
    public class NewsServicev2
    {
        public List<ArticleEntry> GetSectionArticles(IPublishedContent content)
        {
            return content.DescendantsOfType("newsItem").OrderBy(x => x.Value<DateTime>("publishedDate")).Take(9).Select(x => new ArticleEntry()
            {
                Date = x.Value<DateTime>("publishedDate"),
                Headline = x.Value<string>("headline"),
                Manchet = x.Value<string>("manchet"),
                Tags = x.Value<string[]>("tags"),
                Url = x.Url(mode: UrlMode.Absolute),
                Image = x.Value<IPublishedContent>("image")?.GetCropUrl("news grid"),
            }).ToList();
        }
    }
}
Here is a new piece of code. I got rid of all the foreach statements. Not that there’s anything wrong with foreach and nested foreach but be cautious with them due to a risk of decrease of readability, complex ability, and in some cases performance issues.
Next, instead of asking each node what doctype it is, and if it has any children, I simply used the Umbraco 8 feature DescendantsOfType. It provides me with all the nodes of the doctype newsItem, regardless of whether it’s children or grandchildren. Then I order them, take nine, and throw them to my view model - must faster!
A new test gives the result of a response time of 50ms on average and a CPU spike of 2-3%. If I connect 500 users at the same time, I get a slight improvement. The average response time is 1.3S, but the CPU is still hitting the 100% spike for a moment. We can do better than that.
using System;
using System.Collections.Generic;
using System.Linq;
using System.Web;
using Umbraco.Core.Cache;
using Umbraco.Core.Composing;
using Umbraco.Core.Models.PublishedContent;
using Umbraco.Core;
using Umbraco.Web;
using Umbraco_1.Models;

namespace Umbraco_1.Service
{
    public class NewsServicev3
    {
        public List<ArticleEntry> GetSectionArticles(IPublishedContent content)
        {
            var cache = Umbraco.Core.Composing.Current.AppCaches.RuntimeCache;

            return cache.GetCacheItem("newsoverview", () =>
            {
                return content.DescendantsOfType("newsItem").OrderBy(x => x.Value<DateTime>("publishedDate")).Take(9).Select(x => new ArticleEntry()
                {
                    Date = x.Value<DateTime>("publishedDate"),
                    Headline = x.Value<string>("headline"),
                    Manchet = x.Value<string>("manchet"),
                    Tags = x.Value<string[]>("tags"),
                    Url = x.Url(mode: UrlMode.Absolute),
                    Image = x.Value<IPublishedContent>("image")?.GetCropUrl("news grid"),
                }).ToList();
            }, TimeSpan.FromMinutes(10));
        }
    }
}
This is the Umbraco cache service, I have now wrapped my code with a cache function, which expires after 10 min. The first response is 50ms, but all the next ones are 10ms on average, and 1-2% spike in CPU. I try the 500 users at the same time again and now we’re getting somewhere: the CPU spike is 5%, and the average response is 15ms. This only leaves us with a minor issue – even though our performance is now through the roof, if my client creates a new news article, it won’t appear on the front page for the first 10 minutes due to cache. We can work around that by adding an event to the ContentPublishingEvent that will purge the cache if a newsItem is published.
Our job is done. The site with 10.000 articles can respond on 15 ms on average with 500 connected users. But it’s important to have in mind that cache can´t solve everything – we don´t have infinite resources to cache everything we like. Remember to take into consideration that when you use cache you need to be able to purge it easily, not with a server restart. Cache is a clever idea but use it with wisdom. If you want to know more about this, I can recommend Anthony Dang. He opened my eyes about the use of cache at the Umbraco Festival in 2019:
JMeter – a handy tool
My last tip on for now is about JMeter. It’s a tool I got to know a few years back, so I am not an expert yet, but I’ve picked up a few tricks.
JMeter is a 100% pure Java application designed to test functional behavior and measure performance. JMeter is not a browser, but it works on the protocols as a browser, so if you request JMeter to go to your website, it will connect to the defined path and server through HTTP or HTTPS and wait for a response from the server. The test stops when the server returns with a code such as 200, 202, or 500.
JMeter can be used for many different purposes: pressure test a server setup, if Azure environment upscales from one web app to two, when the CPU hits a threshold, or to see how the code performs under pressure. I used JMeter in the example above to test if the NewsService on the front page could handle 500 users. I’ve even set up JMeter on a Windows service for a client to test different paths on their website to make sure a reliable performance was held. So JMeter is a great tool to have in your toolbox.
We’ll start by setting up JMeter: https://jmeter.apache.org/download_jmeter.cgi
Start the application from the unzipped folder you have downloaded and navigate to the bin folder for executing the Apache JMeter file, and a GUI will open. You’re good to go, let’s set up our first test.
Step 1:
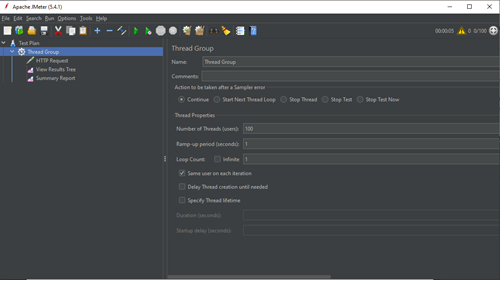
Right-click on test tube Test Plan - add - Threads - Thread Group – this is the configuration of how we want our test to look.
For now, let´s only focus on the two fields Number of threads and Ramp-up period. The number of threads is how many connections you want against your application, so if you pick 100, your application is called 100 times. The ramp-up period is how long it should take JMeter to fire the number of threads that you specified. So if you write 100 threads and 10s for ramp-up, over the next 10 seconds JMeter will call your application with 10 connections every second. If you write 100 and 1, JMeter will call your application with 100 users in the same second.
Be aware of how many threads you want against your application. I speak from experience, as I obviously had to see what happened if I wrote a ridiculous number in the number of threads. The result was a computer with a blue screen of death due to overload of CPU. So keep it simple like 100 or 500. You can go higher but keep your computer’s health in mind.
Step 2:
Once that’s done, right-click the Thread Group in JMeter and pick Add - Sampler - HTTP Request. Here you can specify which URL you want to use for the test, as an example I wrote: protocol - HTTPS, Server - localhost, Port - 44357 (application port) - Path - Path to the API/Page (/Umbraco/api/controller/action or / - for front page).
Step 3:
Finally, I added two things. Right-click on the Thread Group in JMeter and pick Add - Listener - View Results Tree and then right-click on the thread group and pick add - Listener - Summary Report. We are not changing the configurations on any of the views.
View Results Tree show every request JMeter is sending to the configurated HTTP Request, so it shows the status code and the result - just like the network tab in dev-tools. Summary Report shows how many threads were successful, an average time of completion, minimum time of completion of a thread, and maximum time of completion of a thread.
JMeter is now set up, all you have to do is hit the play button in the icon toolbelt and wait for the test to complete. You can see the status in the right corner, where it shows how many threads are left or how many threads are wanted.
The magic of JMeter & Diagnostic tools
Let’s move into the code for an example of how I use JMeter and diagnostic tools. For this test I have an AJAX request from the browser, asking to see all the parcel shops from GLS inside their google maps Lat/Lng bounds. The returned data is shown in Google Maps, so the customer can choose where they want their package delivered. At first the test was completed successfully, nothing to worry about. But later on, we received complaints about long loading times when the customer was trying to choose a parcel shop.
using System;
using System.Collections.Generic;
using System.IO;
using System.Linq;
using System.Net.Http;
using System.Threading.Tasks;
using System.Web;
using System.Web.Http;
using System.Web.Mvc;
using System.Xml.Serialization;
using Umbraco.Web.WebApi;
using Umbraco_1.Models;

namespace Umbraco_1.API
{
    public class GlsParcelshopsController : UmbracoApiController
    {
        public async Task<IHttpActionResult> GetAllByCordinate(decimal SWLat, decimal SWLng, decimal NELat, decimal NELng)
        {
            var paracels = new ArrayOfPakkeshopData();

            //collect list
            using (var client = new HttpClient()
            {
                BaseAddress = new Uri("http://www.gls.dk")
            })
            {
                // init vars
                XmlSerializer serializer = new XmlSerializer(typeof(ArrayOfPakkeshopData));


                client.DefaultRequestHeaders.Accept.Add(new System.Net.Http.Headers.MediaTypeWithQualityHeaderValue("text/xml"));

                HttpResponseMessage response = client.GetAsync("/webservices_v4/wsShopFinder.asmx/GetAllParcelShops?countryIso3166A2=DK").Result;

                if (!response.IsSuccessStatusCode && response.StatusCode != System.Net.HttpStatusCode.OK)
                    return Json(new ArrayOfPakkeshopData());

                var content = response.Content.ReadAsStringAsync().Result;

                using(StringReader sr = new StringReader(content))
                {
                    paracels = (ArrayOfPakkeshopData)serializer.Deserialize(sr);
                }
            }

            if (paracels?.PakkeshopData?.Any() ?? false)
            {
                paracels.PakkeshopData = paracels.PakkeshopData.Where(x => x.Latitude > SWLat && x.Latitude < NELat && x.Longitude > SWLng && x.Longitude < NELng).ToArray();

                return Json(paracels);
            }

            return Json(new ArrayOfPakkeshopData());
        }

    }
}
A single request gives a response time of ~500ms. A speed test with the setup above, and where the numbers of threads are set to 10 threads, gives a response time of ~4.2s – 100 threads and the response time is ~42s. A speed test (number of threads: 100 / ramp-up period: 10) = 10 thread connect to the server every second for the next 10 seconds, the response is ~35s.
The test result reveal something is wrong with the code – if the website is under pressure, and the shop is busy, there is a risk of CPU lock, where the server can shut down or being taken down due to too much noise.
This is where our diagnostic tools come in handy, we’ll use them to take a look at the code. Remember to open Visual Studio in administrator, or you might lose data when working with the diagnostic tools.
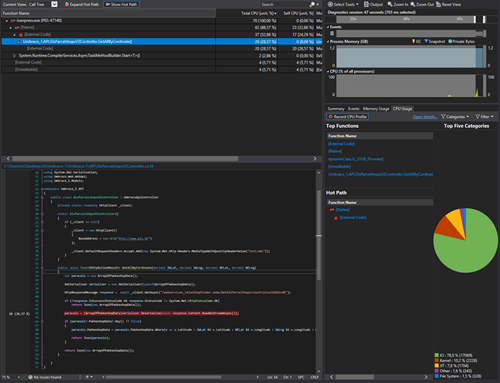
I´ll place a breakpoint at line 20 and line 51 in order to help the diagnostic tools show me CPU usage between only these two breakpoints. In the diagnostic tools, I go to the tab CPU Usage and click Record CPU Profile and then I hit my API with Postman. I skip the first breakpoint and do nothing on the second breakpoint in order to let VS work. After a brief time, a diagram will appear inside the diagnostic tools. Click on Open details, use the current view Call Tree, and you should see something like this:
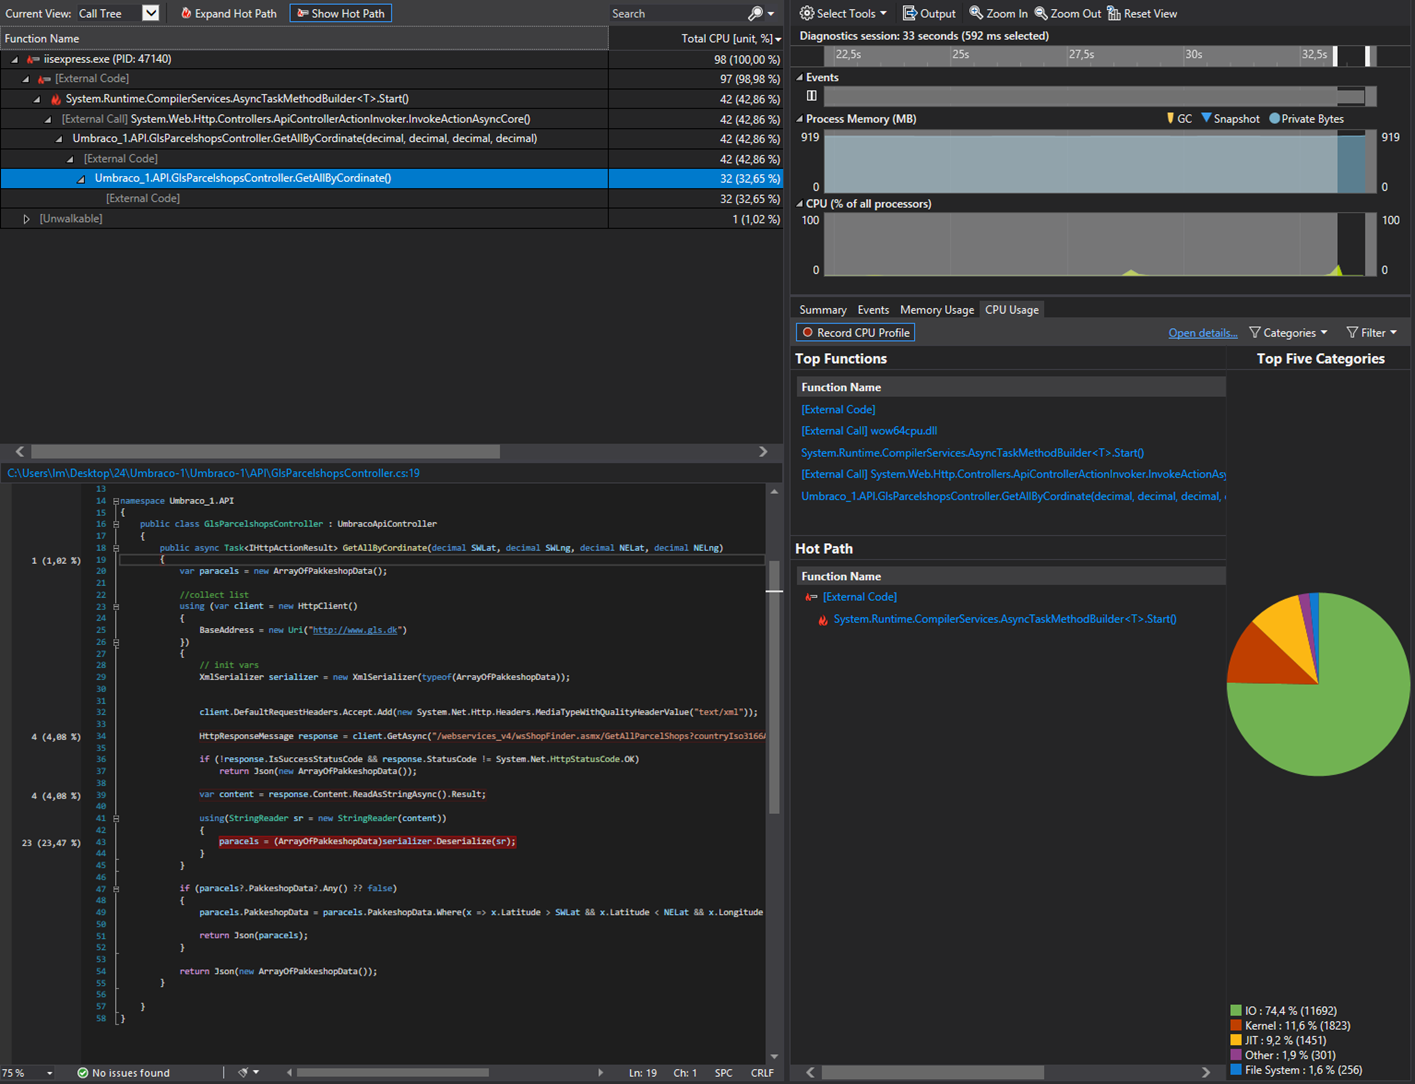
As you can see the API call is spending
21 units of the CPU time to deserialize the XML
4 units of the CPU to perform the web call
4 units of the CPU to read response content to a string.
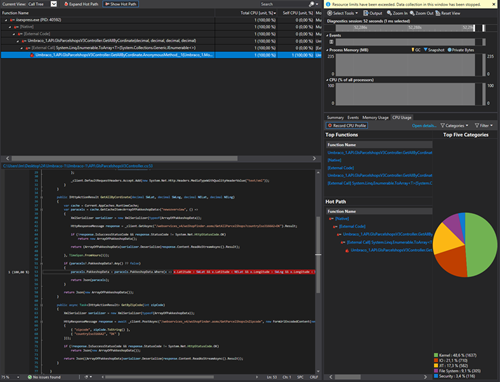
In order to improve the performance, we can remove the using code block with the HTTPClient and add HttpClient to a Static instead. Are you wondering why it make sense to take the HTTPClient out of a using and into a static? For .NET framework v4.8 the reason is this:
"HttpClient is intended to be instantiated once and re-used throughout the life of an application. Instantiating an HttpClient class for every request will exhaust the number of sockets available under heavy loads. This will result in SocketException errors." - https://docs.microsoft.com/en-us/dotnet/api/system.net.http.httpclient?view=netframework-4.8
For Umbraco 9, which is running on .NET, great information can be found here:
https://docs.microsoft.com/en-us/dotnet/architecture/microservices/implement-resilient-applications/use-httpclientfactory-to-implement-resilient-http-requests
You might wonder why we don’t read the requested content to a string and then parses it StringReader, which is inheriting the TextReader class, so we in the end can call the deserialize? Just writing that description exhausts me, so it would be way too much for the CPU, especially when we can read the requested content stream into the deserializer.
using System;
using System.Collections.Generic;
using System.IO;
using System.Linq;
using System.Net.Http;
using System.Threading.Tasks;
using System.Web;
using System.Web.Http;
using System.Web.Mvc;
using System.Xml.Serialization;
using Umbraco.Web.WebApi;
using Umbraco_1.Models;

namespace Umbraco_1.API
{
    public class GlsParcelshopsV2Controller : UmbracoApiController
    {
        private static readonly HttpClient _client;

        static GlsParcelshopsV2Controller()
        {
            if (_client == null)
            {
                _client = new HttpClient()
                {
                    BaseAddress = new Uri("http://www.gls.dk")
                };

                _client.DefaultRequestHeaders.Accept.Add(new System.Net.Http.Headers.MediaTypeWithQualityHeaderValue("text/xml"));
            }
        }

        public async Task<IHttpActionResult> GetAllByCordinate(decimal SWLat, decimal SWLng, decimal NELat, decimal NELng)
        {
            var paracels = new ArrayOfPakkeshopData();

            XmlSerializer serializer = new XmlSerializer(typeof(ArrayOfPakkeshopData));

            HttpResponseMessage response =  await _client.GetAsync("/webservices_v4/wsShopFinder.asmx/GetAllParcelShops?countryIso3166A2=DK");

            if (!response.IsSuccessStatusCode && response.StatusCode != System.Net.HttpStatusCode.OK)
                return Json(new ArrayOfPakkeshopData());

            paracels = (ArrayOfPakkeshopData)serializer.Deserialize(await response.Content.ReadAsStreamAsync());

            if (paracels?.PakkeshopData?.Any() ?? false)
            {
                paracels.PakkeshopData = paracels.PakkeshopData.Where(x => x.Latitude > SWLat && x.Latitude < NELat && x.Longitude > SWLng && x.Longitude < NELng).ToArray();

                return Json(paracels);
            }

            return Json(new ArrayOfPakkeshopData());
        }

    }
}
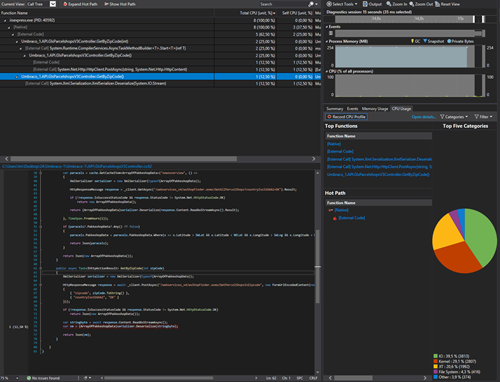
It is still using a lot of time in the deserializer though - 20units. A single test still took ~500ms to respond and ~31s with 100 threads. Not exactly a satisfying performance boost. To get even faster, we can investigate the cache. Do GLS parcel shops change often? Not really. Are the parcel shops critical information? Yes, the customer is using it to tell where their package should be delivered. So a cache might be a great solution in this case.
using System;
using System.Collections.Generic;
using System.IO;
using System.Linq;
using System.Net.Http;
using System.Threading.Tasks;
using System.Web;
using System.Web.Http;
using System.Web.Mvc;
using System.Xml.Serialization;
using Umbraco.Web.WebApi;
using Umbraco_1.Models;
using Umbraco.Core.Composing;
using Umbraco.Core.Cache;

namespace Umbraco_1.API
{
    public class GlsParcelshopsV3Controller : UmbracoApiController
    {
        private static readonly HttpClient _client;
        static GlsParcelshopsV3Controller()
        {
            if (_client == null)
            {
                _client = new HttpClient()
                {
                    BaseAddress = new Uri("http://www.gls.dk")
                };

                _client.DefaultRequestHeaders.Accept.Add(new System.Net.Http.Headers.MediaTypeWithQualityHeaderValue("text/xml"));
            }
        }

        public IHttpActionResult GetAllByCordinate(decimal SWLat, decimal SWLng, decimal NELat, decimal NELng)
        {
            var cache = Current.AppCaches.RuntimeCache;
            var paracels = cache.GetCacheItem<ArrayOfPakkeshopData>("newsoverview", () =>
            {
                XmlSerializer serializer = new XmlSerializer(typeof(ArrayOfPakkeshopData));

                HttpResponseMessage response = _client.GetAsync("/webservices_v4/wsShopFinder.asmx/GetAllParcelShops?countryIso3166A2=DK").Result;

                if (!response.IsSuccessStatusCode && response.StatusCode != System.Net.HttpStatusCode.OK)
                    return new ArrayOfPakkeshopData();

                return (ArrayOfPakkeshopData)serializer.Deserialize(response.Content.ReadAsStreamAsync().Result);

            }, TimeSpan.FromHours(1));

            if (paracels?.PakkeshopData?.Any() ?? false)
            {
                paracels.PakkeshopData = paracels.PakkeshopData.Where(x => x.Latitude > SWLat && x.Latitude < NELat && x.Longitude > SWLng && x.Longitude < NELng).ToArray();

                return Json(paracels);
            }

            return Json(new ArrayOfPakkeshopData());
        }
    }
}
I have wrapped the code that is receiving the data and deserialized it to a function that stores the result in the Umbraco Cache with 1 hour of expiration time. A single test took ~10ms, and 100 threads took ~11ms on average, so now we’re finally kicking ass.
But as mentioned before – we don´t have infinite resources to store cache, and what if the customer expands and opens a web shop in Sweden? Then we would have to store both Sweden and Denmark in the cache. For that reason, I would suggest a change in the UX and use case from freely navigating in Google Maps when choosing a parcel shop based on a list of parcel shop in the zip code – The suggestion above can be done with GLS API, which comes with a search for parcel shops inside a zip code.
using System;
using System.Collections.Generic;
using System.IO;
using System.Linq;
using System.Net.Http;
using System.Threading.Tasks;
using System.Web;
using System.Web.Http;
using System.Web.Mvc;
using System.Xml.Serialization;
using Umbraco.Web.WebApi;
using Umbraco_1.Models;
using Umbraco.Core.Composing;
using Umbraco.Core.Cache;

namespace Umbraco_1.API
{
    public class GlsParcelshopsV3Controller : UmbracoApiController
    {
        private static readonly HttpClient _client;
        static GlsParcelshopsV3Controller()
        {
            if (_client == null)
            {
                _client = new HttpClient()
                {
                    BaseAddress = new Uri("http://www.gls.dk")
                };

                _client.DefaultRequestHeaders.Accept.Add(new System.Net.Http.Headers.MediaTypeWithQualityHeaderValue("text/xml"));
            }
        }

        public async Task<IHttpActionResult> GetByZipCode(int zipCode)
        {
            XmlSerializer serializer = new XmlSerializer(typeof(ArrayOfPakkeshopData));

            HttpResponseMessage response = await _client.PostAsync("/webservices_v4/wsShopFinder.asmx/GetParcelShopsInZipcode", new FormUrlEncodedContent(new Dictionary<string, string>()
            {
                { "zipcode", zipCode.ToString() },
                { "countryIso3166A2", "DK" }
            }));

            if (!response.IsSuccessStatusCode && response.StatusCode != System.Net.HttpStatusCode.OK)
                return Json(new ArrayOfPakkeshopData());

            var stringbyte = await response.Content.ReadAsStreamAsync();
            var vm = (ArrayOfPakkeshopData)serializer.Deserialize(stringbyte);

            return Json(vm);
        }
    }
}
Final test: Single user ~60ms response time. 100 threads ~70ms response time and a total of 3 units of the CPU units. We’re no longer relying on the cache, we always have the newest GLS dataset and it works in both Denmark and Sweden without any additional changes. It may even work in other countries as well. Success.
Just a few final notes regarding JMeter. If you want to speed test your application, remember to notify the customer and hosting provider. A JMeter speed test is quite heavy, and your hosting provider could mistake the overload for a DOS attack. And it’s probably a good idea for your client to know what’s going on if their website suddenly crashes.
I hope you learned something and that you will start testing more. Especially speed test critical areas like the front page to make sure it can withstand a normal load on a busy day or think of creative ways to solve performance issues.
Merry Xmas to all.